Prompted by a comment from my earlier post on Google search trends vs. stock price, I applied the same technique to a handful of small-cap Russell 2000 companies. That is to say, I overlaid the stock price with the number of Google search trends since 2005 and then calculated the correlation.
Trawling through this list was an entertaining exercise in itself. I discovered companies offering products/technologies I’d never heard of but use every day (Synchronoss being an indirect example).
Jumping straight to the conclusions, the results weren’t so well matched. In an attempt to improve the correlation, I ended up calculating the rolling median value for searches and stock prices to remove the day-to-day noisy variations.
I’m guessing that smaller-cap stock companies translate into a smaller online presence as well which may lead to less stable correlations between searches and stock price. However, that did not stop me making some conclusions.
Here’s the results on the companies I looked at:
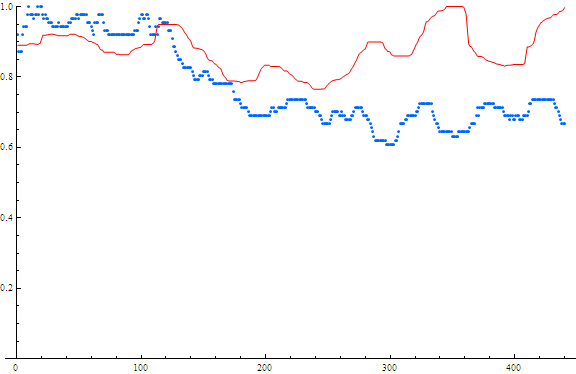
First up is Synchronoss, a company that provides cloud services to many wireless, broadband and device manufacturers. The overlay yielded a correlation of 0.76, the highest result of the 10 stocks I looked at. They are a fairly new company and the fact that Internet searches started at roughly the same time as the stock offering makes me think they must have been in super-stealth mode right up until the IPO!
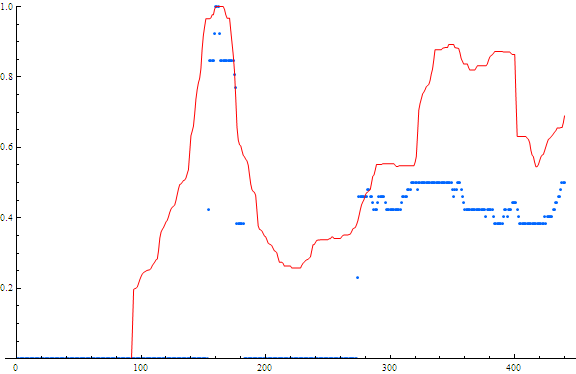
Searches and Stock price for Synchronoss.
Red=stock price
Blue=searches
x-axis is weeks from May 2004 – May 2013
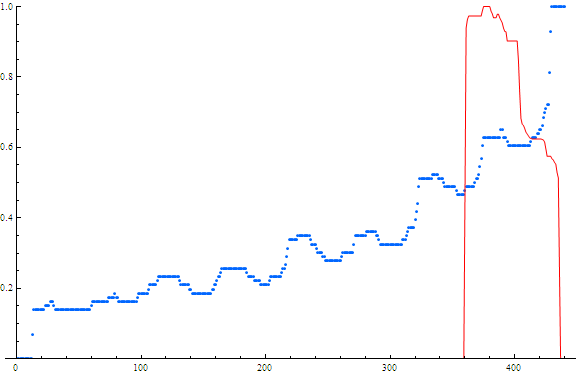
Next was Solazyme — another interesting company. They use a sunless fermentation process to convert algae into various types of oils (for fuel *and* for eating!). Their correlation was 2nd closest at 0.62 (admittedly, the stock hasn’t been listed for very long yet and the result looks more encouraging than a mere 0.62):
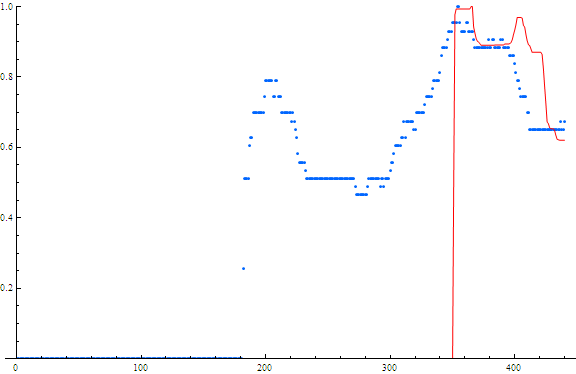
Searches and Stock price for Solazyme.
Red=stock price
Blue=searches
x-axis is weeks from May 2004 – May 2013
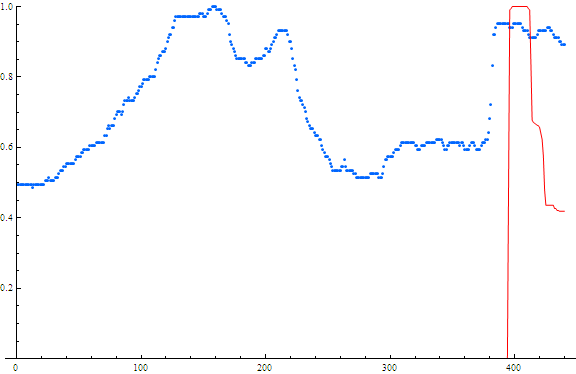
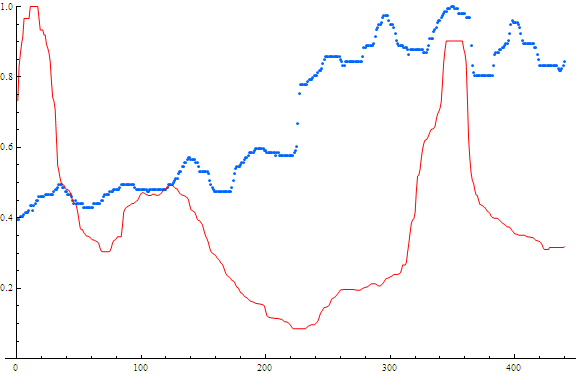
Shutterfly (makers of the Chiou family Christmas card and limited edition family calendar) is apparently new enough that it is a small cap. It appears the stock price bounces around like a ball, but the Internet search volume has steadily grown since 2005. I’m guessing this stock could be under-valued. The correlation was 0.617.
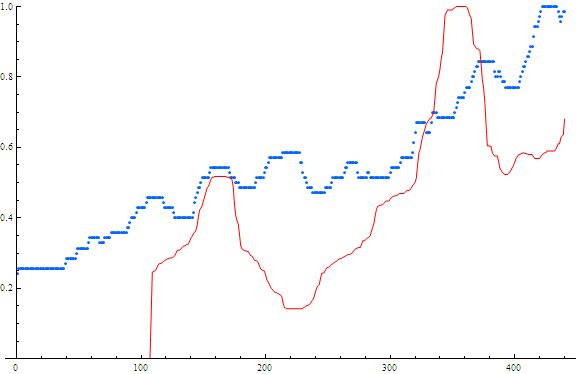
Searches and Stock price for Shutterfly.
Red=stock price
Blue=searches
x-axis is weeks from May 2004 – May 2013
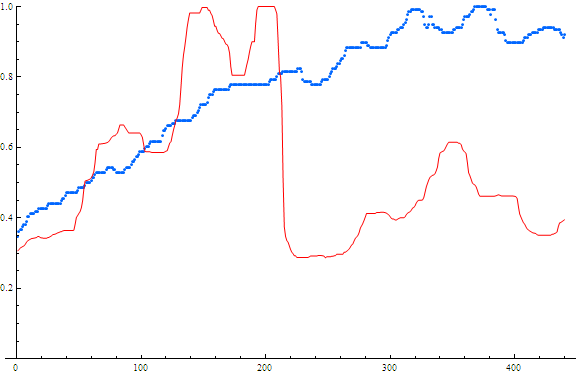
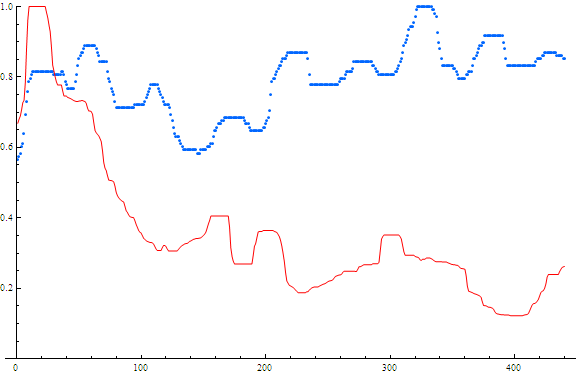
Another small cap surprise to me was Radio Shack. They have a pretty solid physical retail presence and have been around since 1921, so I didn’t realize they were a small company. The correlation between search and stock price was 0.57. The search results dipped, but have since leveled off while the stock price has seriously tanked. I haven’t looked into what might have caused this, but physical retail has taken a hit from online-only retail outlets, so searches may not be the best guide to actual stock value here! Although Radio Shack should be encouraged that searches have remained strong for their brand (perhaps a suggested business emphasis for them?).
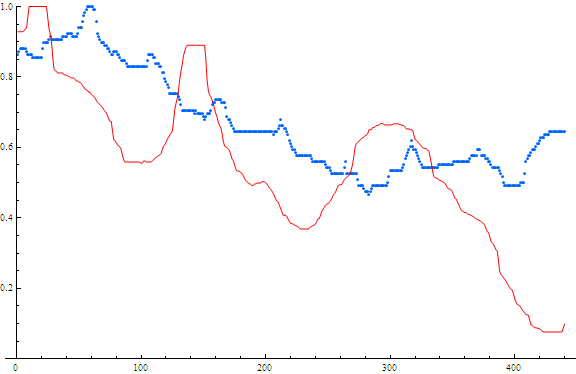
Searches and Stock price for Radio Shack.
Red=stock price
Blue=searches
x-axis is weeks from May 2004 – May 2013
The remaining stocks all had near-0 correlations, so I’ll just sweep quickly through them:
Tootsie Roll: correlation = 0.22. The stock price just dithers around, as do the searches. I’m not sure why anyone would Google Tootsie Roll anyways.
Searches and Stock price for Tootsie Roll.
Red=stock price
Blue=searches
x-axis is weeks from May 2004 – May 2013
Teavana: correlation=0.14. Surprise! While I was doing the computations, Teavana was bought out by Starbucks. The buyout price wasn’t that great for the stock holder. Anyways, this stock probably isn’t the best example.
Searches and Stock price for Teavana.
Red=stock price
Blue=searches
x-axis is weeks from May 2004 – May 2013
CafePress: correlation=0.11. Waiting to see how this one goes… Right now, the correlation is very weak.
Searches and Stock price for CafePress.
Red=stock price
Blue=searches
x-axis is weeks from May 2004 – May 2013
Tesco: correlation=-0.074. Stock price weak, Internet searches strong. Hmmm… I don’t really know the back story here.
Searches and Stock price for Tesco.
Red=stock price
Blue=searches
x-axis is weeks from May 2004 – May 2013
Travelzoo: correlation=-0.088. Another one with a sagging stock price. The Internet searches climbed and have then dithered around for the past few years. Another one where I don’t really know the back story.
Searches and Stock price for Travelzoo.
Red=stock price
Blue=searches
x-axis is weeks from May 2004 – May 2013
Overstock: correlation=-0.15. Ok, looking at Overstock’s Wikipedia page, there’s some sort of issues with Wall-street and management. I’m not really sure I get the full picture, but it looks like the founder is accusing Wall-street of price-tampering. So the dip in stock price may be artificial. In which case Overstock MIGHT be a good bet. Or maybe not.
Searches and Stock price for Overstock.
Red=stock price
Blue=searches
x-axis is weeks from May 2004 – May 2013
