I recently wondered if Internet searches for companies correlate with the company’s stock price. A few years ago a researcher at Google was able to track flu trends by monitoring online searches for flu symptoms. Would searches translate to stock price as well? To answer the question, I used Google’s “trends” utility and Google’s finance utility to extract data on a handful of companies. It’d be nice to use a larger set, but Google shut down its financial data API late last year and disconnects any robots it detects. So here’s the results on the 12 companies for which I hand-downloaded the data.
The Good News
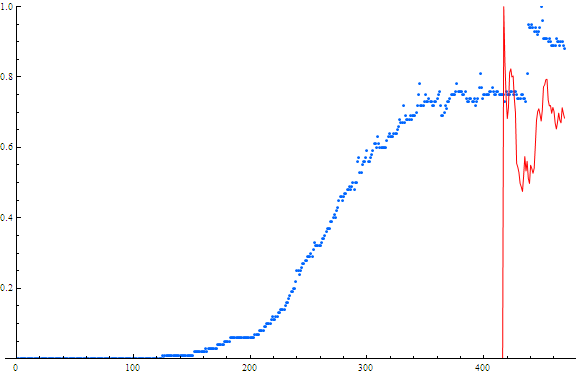
Some companies seem to be VERY closely tracked by Internet searches. Google’s own stock stands out as a stellar example. The x-axis shows the weeks from May 2004 until May 2013 — 9 years of results. The correlation of these two lines was 0.823!
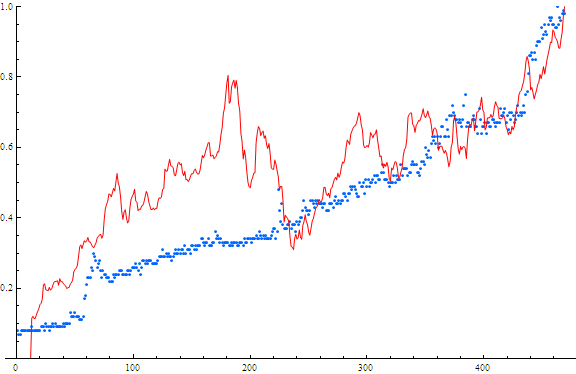
Searches and Stock price for Google
Red=stock price
Blue=searches
x-axis is weeks from May 2004 – May 2013
A few other close matches:
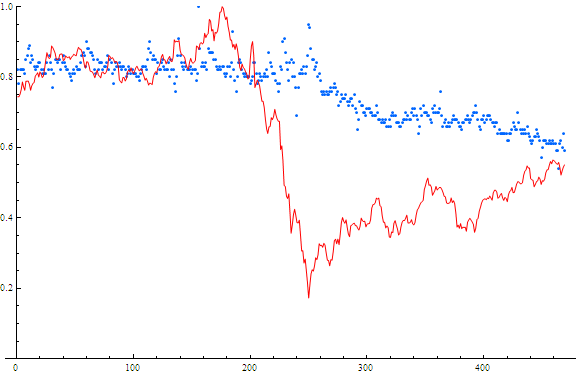
Amazon’s searches and stock price had a correlation of 0.875 — even better than Google. It’s nifty to see the seasonal surges in the search results. The peaks of the surges also seem to show temporary dips in the stock value — perhaps investors selling off their stock when the seasons hit their peaks?
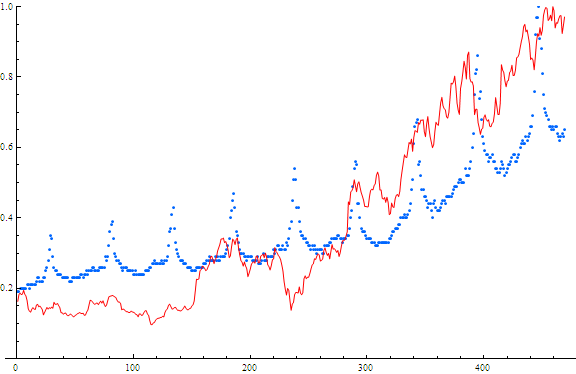
Searches and Stock price for Amazon.
Red=stock price
Blue=searches
x-axis is weeks from May 2004 – May 2013
Although the stock has only been on the market since the end of 2011, “LinkedIn” had a correlation in stock price and search frequency of 0.891.
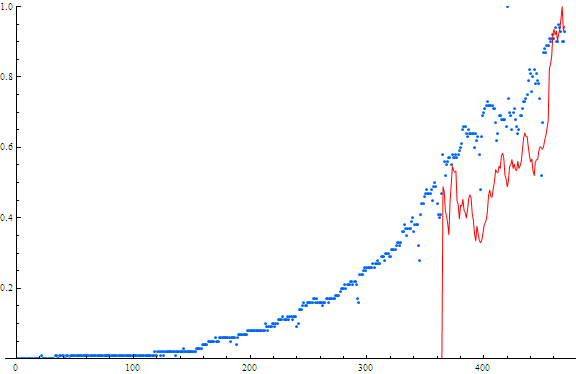
Searches and Stock price for LinkedIn.
Red=stock price
Blue=searches
x-axis is weeks from May 2004 – May 2013
The OK
Then there were stock prices that only sort-of followed their search results.
Apple had a correlation of 0.727. The huge surge in stock price in early 2012 threw off the correlation since the number of Internet searches was steady (minus seasonal cycles). However, look closely at the chart and you will see an interesting fact — the stock price eventually floated down from the sky and rejoined the search level. Perhaps the correct way to look at it is the stock price tracks search levels rather than the other way around.
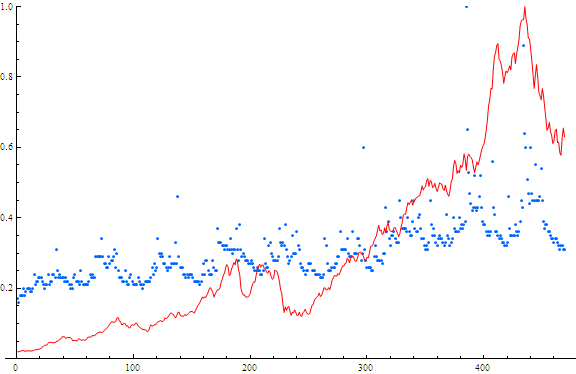
Searches and Stock price for Apple.
Red=stock price
Blue=searches
x-axis is weeks from May 2004 – May 2013
Facebook was low — however, the data is very brief since the stock came out not long ago. Looking at the chart I see a leap in searches right around the big IPO — and a corresponding dip in the stock price. Otherwise they look like they might equalize soon.
Searches and Stock price for Facebook.
Red=stock price
Blue=searches
x-axis is weeks from May 2004 – May 2013
GE had a correlation of 0.636. The big dip occurred during the 2008 recession, although searches waned much more slowly. Again, it looks like the two will be equalizing soon.
Searches and Stock price for GE.
Red=stock price
Blue=searches
x-axis is weeks from May 2004 – May 2013
The Anti-Good
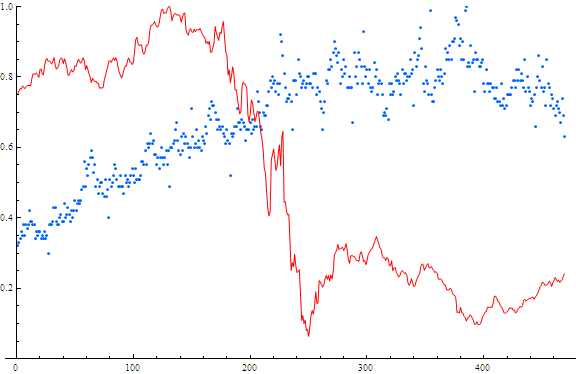
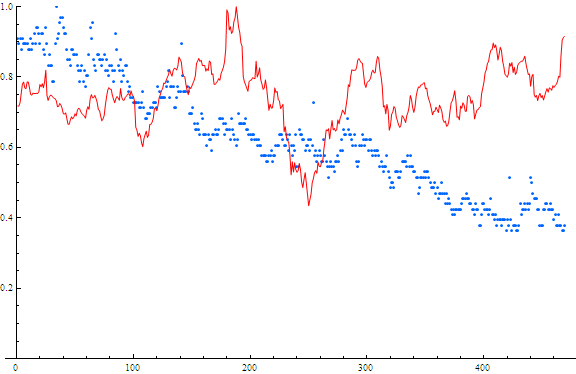
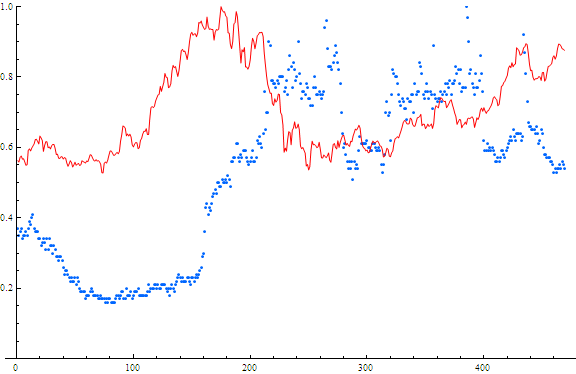
Then, there were stocks that had negative correlation. The most strongly anti-correlated stocks (of the 12 I looked at) were Yahoo! (-0.887) and Bank of America (-0.779). Interesting… Since Internet searches are still strong on these terms is it possible these stocks are undervalued and destined to recover their value?
Yahoo!’s chart:

Searches and Stock price for Yahoo!
Red=stock price
Blue=searches
x-axis is weeks from May 2004 – May 2013
and Bank of America:
Searches and Stock price for Bank of America
Red=stock price
Blue=searches
x-axis is weeks from May 2004 – May 2013
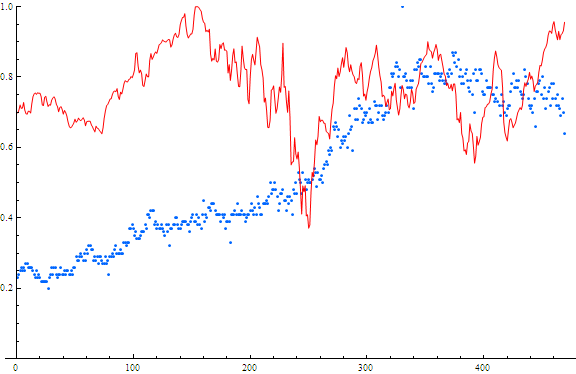
Coming in close behind these companies is RIM with a correlation of -0.565. I actually searched for “Blackberry” since the Blackberry is the name of their flagship (and only) product.
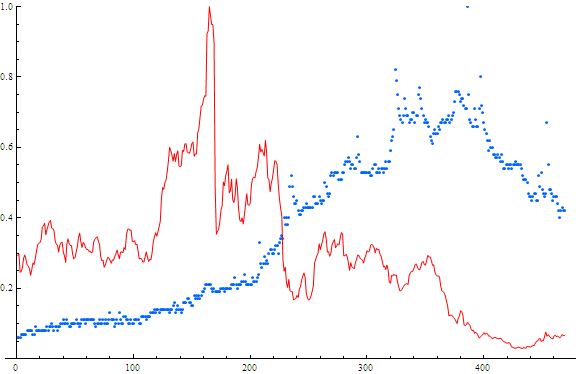
Searches and Stock price for Blackberry.
Red=stock price
Blue=searches
x-axis is weeks from May 2004 – May 2013
The Boring
The remaining three companies, Microsoft, AT&T and Chase, showed a correlation close to 0.
Microsoft’s correlation of -0.0947:
Searches and Stock price for Microsoft.
Red=stock price
Blue=searches
x-axis is weeks from May 2004 – May 2013
AT&T’s correlation of 0.0518:
Searches and Stock price for AT&T.
Red=stock price
Blue=searches
x-axis is weeks from May 2004 – May 2013
Chase’s correlation of 0.0168:
Searches and Stock price for Chase.
Red=stock price
Blue=searches
x-axis is weeks from May 2004 – May 2013
Conclusions
My optimistic conclusion on this mini-project is that the search frequency tracks what the stock price “could be”. Under that interpretation, Yahoo!, Bank of America and RIM would be definite “buys” (as of today, 5/17/2013). But I’m in no way an officially trained investment trader, so don’t take anything written in this blog post too seriously! It will be interesting to follow up on my predictions a year from now to see how well my conclusions fared.
Does anyone else have an idea for interesting stocks to compare?
UPDATE: After doing this post and then googling around to see what others have done, it turns out there’s a researcher who has used Internet searches to try to predict the whole market (the total Dow Jones index value, etc.). They’ve had some success, but were unable to predict actual stock prices using their methods. I’m guessing that’s because individual stock prices do not necessarily reflect anything rational. My approach was simpler in that I only searched for company name (or product) and nothing else and calculated the correlation with individual stocks rather than the market as a whole.
References
The website for google trends: http://www.google.com/trends/
The website for google’s stock data: https://www.google.com/finance

Interesting. Did you do any analysis of smallcaps? For the most part, I can get a general feel for most of the companies you listed; the smaller companies, not so much.
Tim Dickinson liked this on Facebook.
David Cuthbert: any suggestions?
How about those on the Russell 2000?
Phoebe Rose Erler liked this on Facebook.
Mallika Paulraj and David Cuthbert: In between norovirus (2nd time this year) and relatives visiting from Taiwan, I looked at 10 stocks from Russell 2000. The results weren’t as correlated, but still showed promise. http://www.researchpipeline.com/wordpress/2013/05/29/a-fast-look-at-a-few-small-cap-stocks-from-the-russell-2000-index/
I would think that Google searches would correlate better with volatility instead of price. Not as useful for making money, unfortunately.
David Cuthbert: volatility is the day-to-day variations? Actually, it tracks that near a correlation of 0 (I checked it). My guess is that searches reflect the level of consumer interest as well as general interest (due to news stories, etc). You’d think that would be a good indicator for stock value, but…
Roughly, yes. It doesn’t have to be over a single day; it can be any time period. Beta (compared to the S&P 500) is the usual calculation used for volatility.