For a moment, suspend fairness to honest, prudent homeowners. Forget about providing “correct” market incentives. And disregard any other emotional or political problems that accompany this particular idea. It is widely agreed that the “Great Recession of 2006” was caused by the failing of mortgage-backed securities. So it seems like a simple approach to restoring normalcy and security to these securities back in 2008 might have been to buy the outstanding home loans sold during the bubble years — let’s be generous and say 2001 to 2009.
The red line in the chart below shows the real-world mean price of home sales since 1968 to 2010 (from the US Census website). The blue line is a simplistic parabolic fit to the home values.
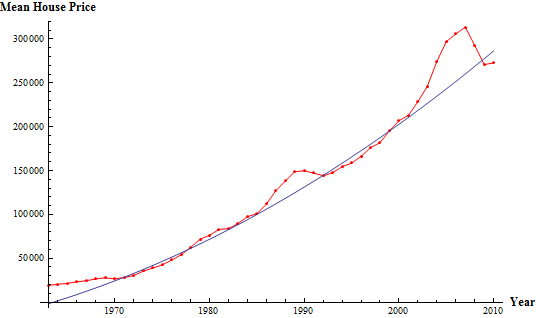
The total number of new home sales during the bubble period can also be found on the US Census website. I managed to find existing home sales on the Bloomberg website (as an aside, although the US government tracks new home sales, existing home sales seems to be privately tracked and I was lucky to find this table for free). By adding together new and existing home sales and multiplying by the average home sales price (for each year), you can calculate the total value of all these loans: $1.4 trillion.
Does that seem like a humongous number? CNN Money published a chart at the end of 2010 claiming that the amount of spending on federal stimulus programs totaled $2.8 trillion. Googling around a bit shows this figure to be controversial. The Washington Post puts the figure closer to $1 trillion. A supposedly non-partisan web site, stimulus.org, places the total (as of July 2013) at $2.3 trillion, with an eventual maximum of $5.96 trillion. It all seems to depend on what you call “stimulus”. The Washington Post doesn’t include tax breaks, for instance.
This spending includes the bailout of Freddie and Fannie, Bush’s and Obama’s stimulus programs, the TARP program and tax relief programs. But really, the heart of the problem was the bad mortgages. What I’m proposing is essentially a TARP program for mortgage owners.
Alright, you may object that I haven’t included home equity loans in my quick analysis. This data was harder to come by, but if I can find it, I can improve my total.
You might also ask: what if someone doesn’t want their home bought? Clearly, no one should be forced to sell their home. Well, who owns the homes the government does buy? The US government would own the homes it buys. Like TARP, there should be a way for home owners to buy back their property (which could potentially lower the total amount spent). But this is getting into the messy details, so I’ll stop this blog post here and just wonder — why didn’t we take this step back in 2008?
Resources:
Wikipedia’s article on the “Great Recession”: http://en.wikipedia.org/wiki/Great_Recession
US Census home prices per year since 1968: http://www.census.gov/const/uspriceann.pdf
Bloomberg’s existing home sales historical data: http://www.bloomberg.com/news/2012-01-20/u-s-annual-existing-home-sales-table-.html
CNN Money 2010 article on stimulus spending: http://money.cnn.com/2010/12/20/news/economy/total_stimulus_cost/index.htm
Washington Post article on stimulus spending: http://www.washingtonpost.com/blogs/wonkblog/post/the-real-price-tag-for-stimulus-between-1-trillion-and-17-trillion/2011/08/25/gIQA2Cc41Q_blog.html
stimulus.org: http://stimulus.org/
