In 1938 the United States set the federal minimum wage at 25 cent an hour. Since then, the minimum wage has been making small discrete jumps to today’s rate of $7.25 an hour.
But after adjusting for inflation, the minimum wage has been decreasing ever since the peak value (in today’s dollars) on February 1968 at $11.09 per hour.
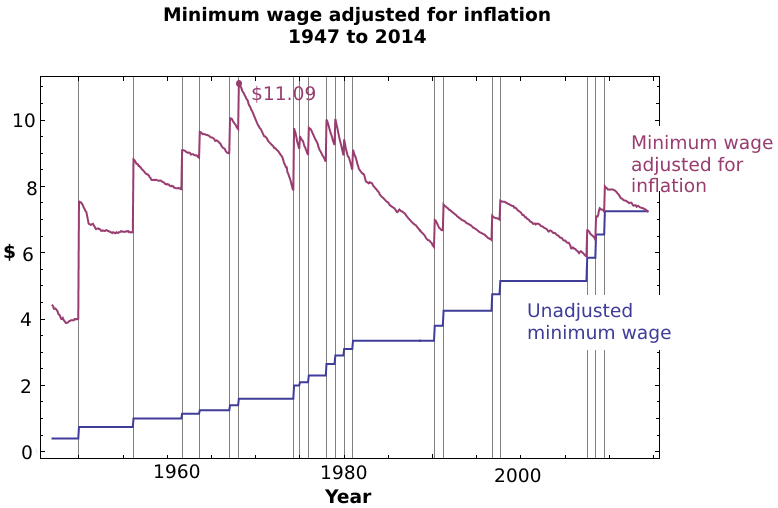
The lowest adjusted minimum wage in recent times was $5.89 in June 2007, about half of the adjusted minimum wage in 1968.
It’s interesting looking at the downward slope of the adjusted minimum wage — that’s the work of inflation. The highest point is always right after it has been raised and then the buying power continues to drop until the next minimum wage reset. After the peak minimum wage in 1968, it took roughly 2 years for inflation to reduce the buying power to it’s pre-boost level of $9.70.
Sources:
- Minimum wage values were taken from Department of Labor’s website: http://www.dol.gov/whd/minwage/chart.htm
- To calculate adjusted wages, I used the monthly consumer price index from the Bureau of Labor Statistics: http://www.bls.gov/data/ — specifically, the first consumer price index listings from here: http://download.bls.gov/pub/time.series/cu/cu.data.1.AllItems
