I am a night time runner. It’s completely impossible for me to get out for my 5 mile run before my kids are tucked in bed and asleep. Being a night time runner has some unexpected perks — namely, it’s never too overbearingly hot to run and, most of the time, the rains magically cease between 8pm and 10pm, so I rarely get drenched. However, I sometimes find myself coughing away like a smoker when I’m out running and I wondered if pollution in the air was somehow worse during the night than other times of the day.
To answer the question, I found air quality data from the Bay Area’s Spare the Air website. The organization maintains air quality monitors around the Bay Area that measure five types of pollution: black Carbon, Nitric Oxide, Nitrogen Dioxide, ozone and pm 2.5 (particle matter with size less than 2.5 micrometers). Of these pollutants, pm 2.5 and ozone have the greatest health impact, being associated with heart and lung disease.
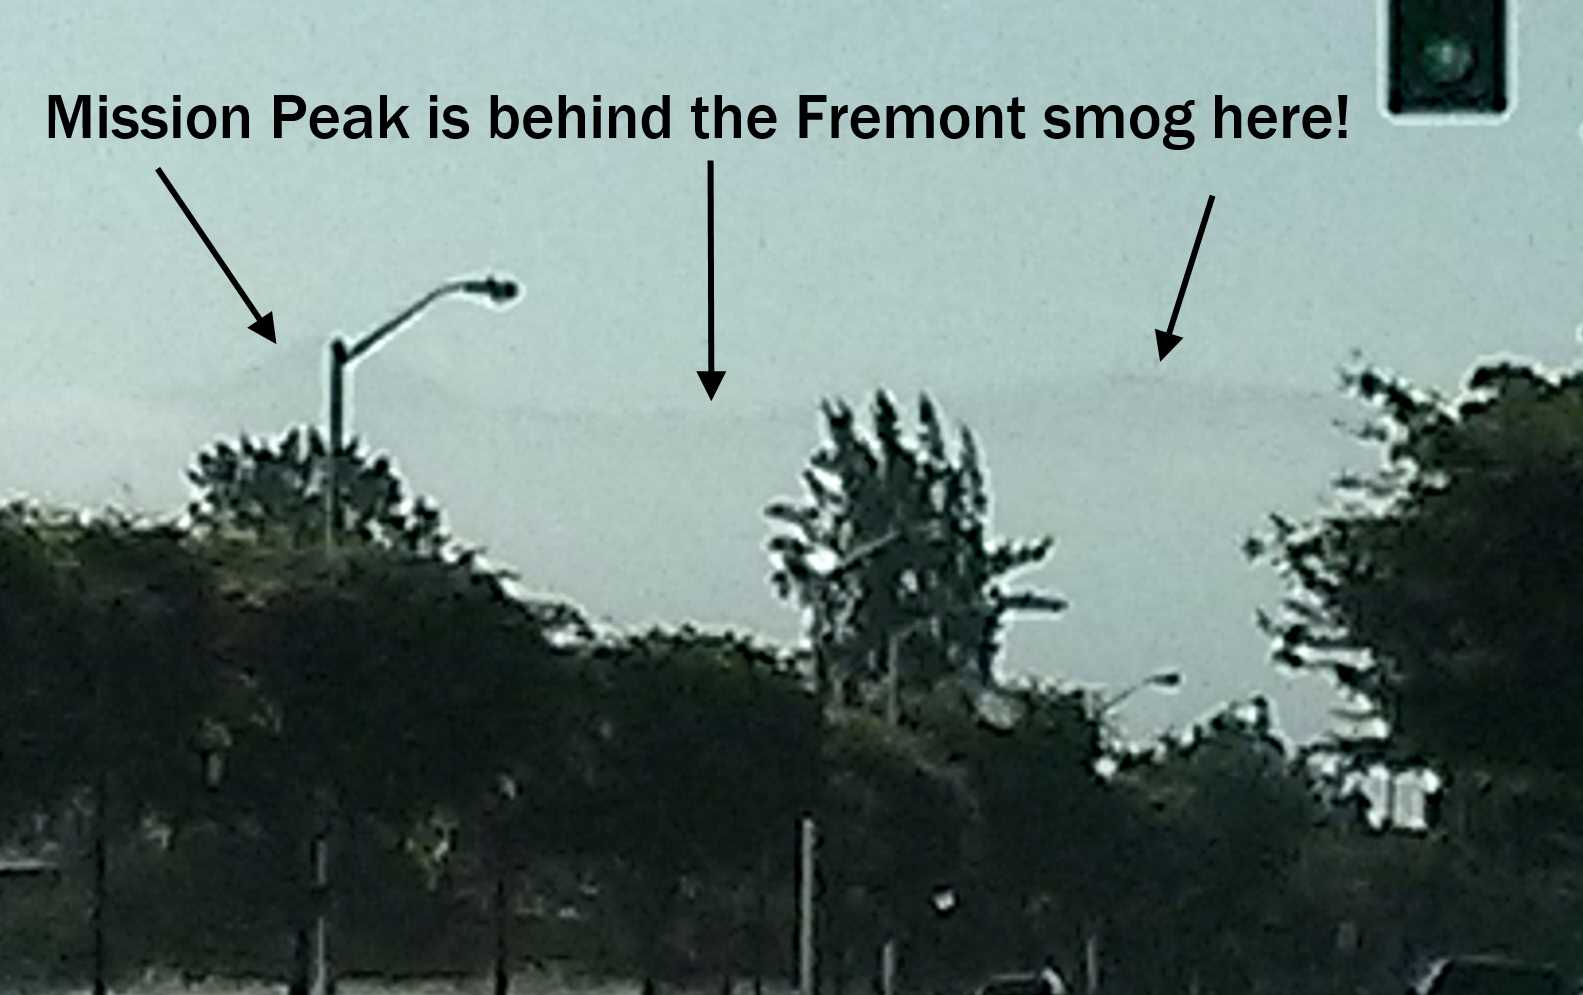
I called up Spare the Air and chatted with someone in the public information department who explained that the pollution in our Tri City area (Union City, Fremont and Newark) actually traveled in from Livermore. The winds blow out from Livermore, through the Altamont Pass, and into the Tri City area. So there were no separate air pollution stations in my area and I should just use the Livermore air measurements as an indication of the air quality here. I asked if I could get the corrected data and was transferred over to the data department where I was told “no”. And that was the end of the conversation. Having no other recourse, I scraped the raw, uncorrected 2013 data from the website and that’s how I have the numbers to pore over*.
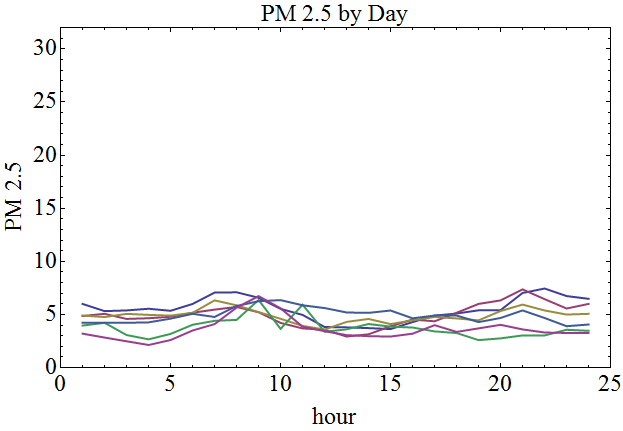
Here’s what I saw when I initially graphed the pm 2.5 data, averaged over the year 2013 into 24 hour bins (the units are μg/m³) :
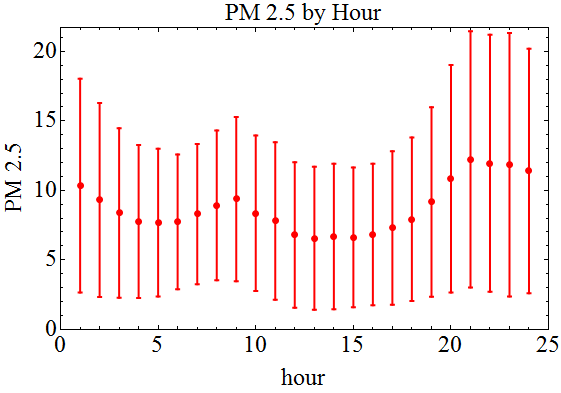
So, indeed, the mean pollution levels went up at night, albeit not by much. But whoa!!! Look at those mean deviation bars!!! They practically span the entire range!
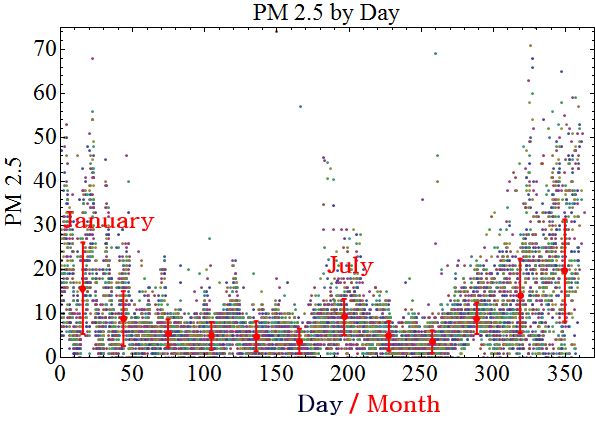
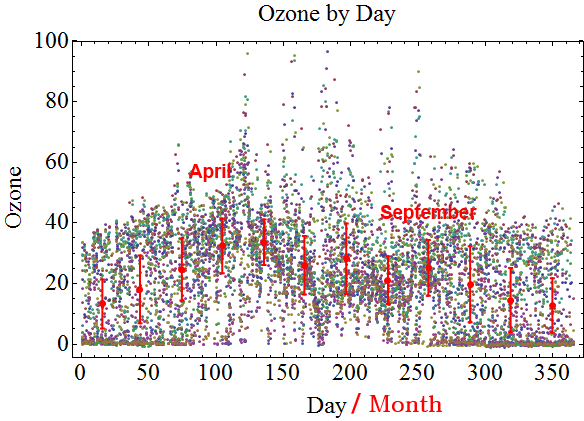
Ok, so this is probably something well-known to air quality scientists, but it was a discovery for me: when I averaged by day instead of hour, I discovered that the levels of pollution vary seasonally. I’ve superimposed the monthly means and deviations over a plot of all the actual daily pollution measurements and you can see the source for such noisy averages.
So what is the hourly variation like in the highest pollution months vs. the lowest months? Here’s the data in two different graphs that show the difference. The winter months were by far the worse, except for a mid-summer spike in July, oddly enough.
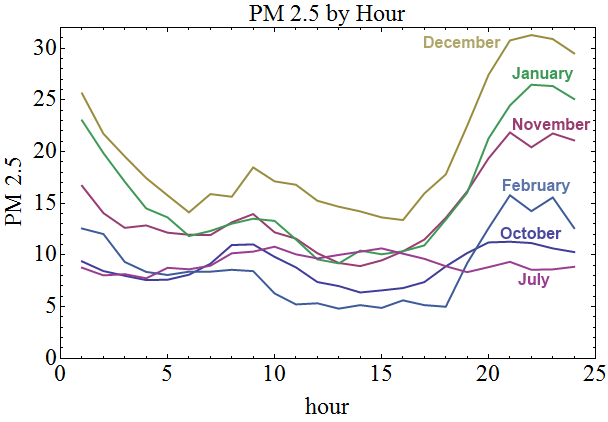
The rest of the months had low PM 2.5 values that were even across all hours:
For the summer months, the mean deviation bars are narrow, but there is still quite a bit of variation for the winter months. Rather than paste each graph separately for all 12 months, I made this handy gif:
The months that spiked the most at night were November, December and January. When I summed up the actual measured pm 2.5 levels during my jogging window (8pm – 10pm) I ended up with 51% higher levels compared to the average levels for the year.
Alarming results! Looking at the charts, the best exercise window seemed to be anywhere from 5am to 5pm (when sane people exercise anyways). But why on Earth were the levels so high during the winter nights?
I called up Spare the Air again. It turns out that during the winter, temperature inversions act to put a heat cap on the cold air below, trapping the pollution particles. This happens sporadically which is why the data is so noisy. I’d also forgotten about an important nighttime pollutant — household fireplaces. It’s surprising how large an impact fire places have on air quality since only a small minority of houses have fires on any given night. And it turns out that the higher levels in July were likely due to wildfires which can pollute air over large distances.
The public information guy also informed me that ozone is an important summertime pollutant. So I took a look at how that cycles during the day.
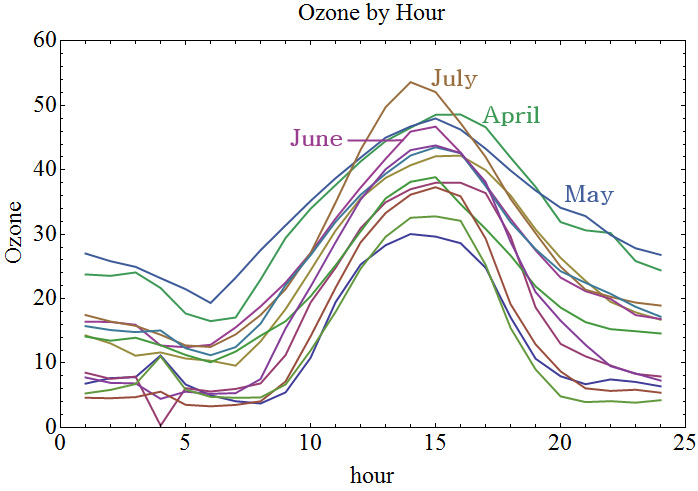
Looking at the hourly plot, it turns out that the peak ozone window occurs from around 11am to 6pm! So at least during the summer, night time running is actually healthier. The chart below shows all the ozone means and deviations plotted for the months of the year. The worst ozone season runs from late Spring until late Summer.
So my take away from all this is that morning runners are giving their lungs the best treatment. During the spring and summer, late morning to evening summer air is filled with ozone. And during the winter, the night air often has high pm 2.5 levels. So the only consistent high quality air window was from about 5am to 10am.
To be honest, I will probably keep running at night simply because the choice at this point in my life is to run in elevated winter pollution or to skip working out at all. But just as soon as it makes sense, I hope to convert back to the morning workout schedule I had before the kids came around.
Sources:
- Spare the Air’s science portal which links to the live, raw, uncorrected data from their air quality monitors: http://gate1.baaqmd.gov/aqmet/aq.aspx
- Beijing’s air quality index live feed (it’s horrible!): http://aqicn.org/city/beijing/
*Ok, since then, I saw a link on the website where you can make a written request for data. I applied to get the data and received a phone call a few days later from someone who told me that while the corrected data is not a public record, they were still willing to send me the 2013 data for free. If I wanted any more, there would be a stiff fee. So I’m waiting to get the official, corrected 2013 data. If it produces wildly different results from the raw data, I may update this blog entry…

Great article with very professional data analysis!
Pingback: Guest Post: The Best Time, Surface, and Distance to Run (According to Science) - RunningSoleGirl
Really useful presentation of the data. I was actually interested in this topic because I was curious about how bad the pollution is in the morning.
Currently, I run an hour before sunset and where I live the breezes off the bay are pretty consistent, but may change to morning runs because of work.
My guess is July is so bad because of the fireworks.