This is an update to my previous blog post wherein I concluded that the optimal exercise window was from 5 am to 10 am (from an air quality stand point). In this post, I review the corrected data and received some advice which narrowed the window to 5 am to 7 am…
Less than a week after I’d clicked “Publish”, I received a call from Kurt Malone, a supervising air quality meteorologist from BAAQMD (which runs sparetheair.org). My request for the corrected data had been received and he emailed me several spreadsheets!
Kurt explained that the website data is mostly correct, but sometimes the measurements can be affected by malfunctions in the detectors and they posthumously throw out such measurements. In my previous post, I was looking at Livermore’s PM 2.5 and ozone measurements which are the most significant air pollutants in the Bay Area. When I overlaid Livermore’s corrected PM 2.5 data (blue) on top of the website data (red), this is what I saw: 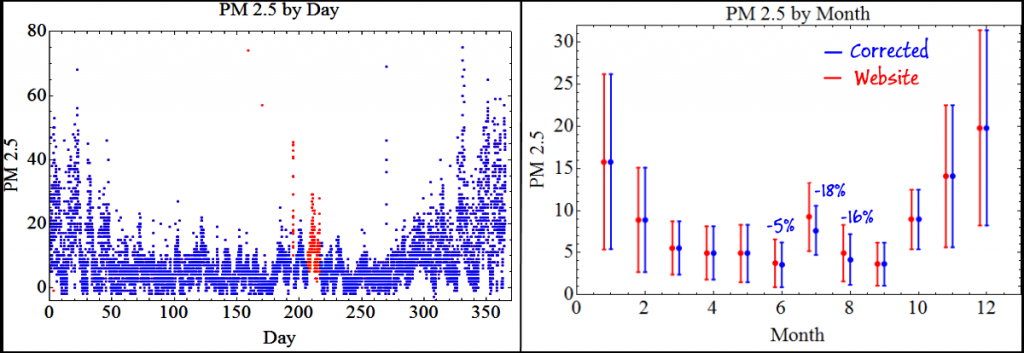 Basically, a range of points in July and August had been discarded and two very high measurements on other days had also been dropped. This made for an overall correction of 2.5% averaged over the year.
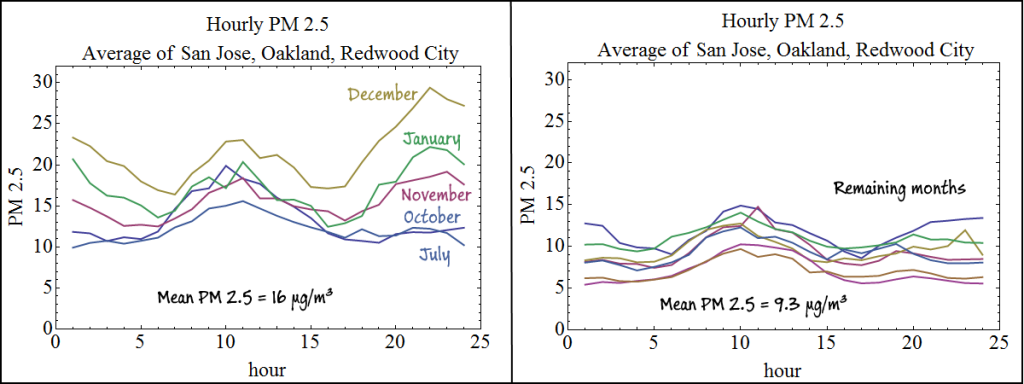
Kurt also explained that most of the time I should be averaging Oakland, San Jose and Redwood City air qualities to infer the Union City/Fremont air quality. Livermore only makes sense when there are high Westerly winds. Crunching the corrected data showed a different result from Livermore’s. I was surprised to discover a small, broad peak from 7 am to 2 pm (not easily seen in the Livermore data) and then another, larger-during-the-winter peak from around 7 pm to 3 am.
Redoing the averaged data for ozone gave a bump in the afternoon that lasted into the early hours of the next morning. However, it’s worth pointing out that ozone levels are not supposed to exceed 75 ppb, so these curves are still considered safe — even in April and May. Even looking at the raw data, there is only 1 hour of 1 day where the ozone levels went up to about 80 ppb.
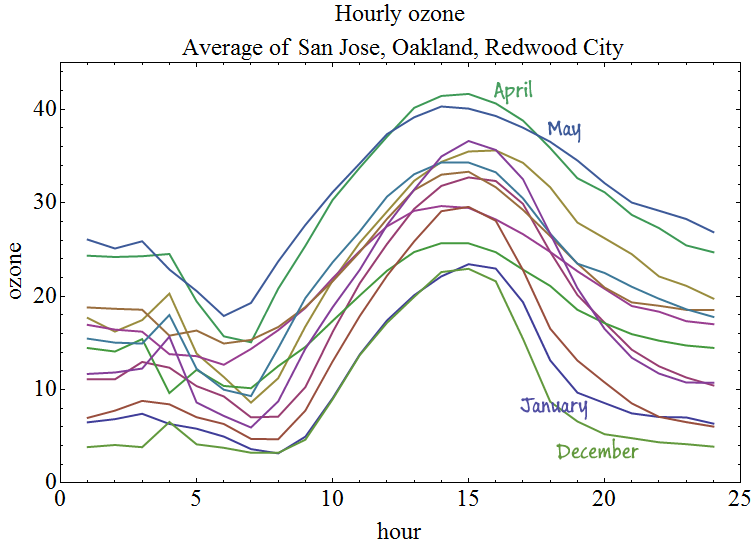
Examining these two charts shows that maybe the optimal running window is not as broad as I’d thought. It looks like 5 am to 7 am is clear all year round.
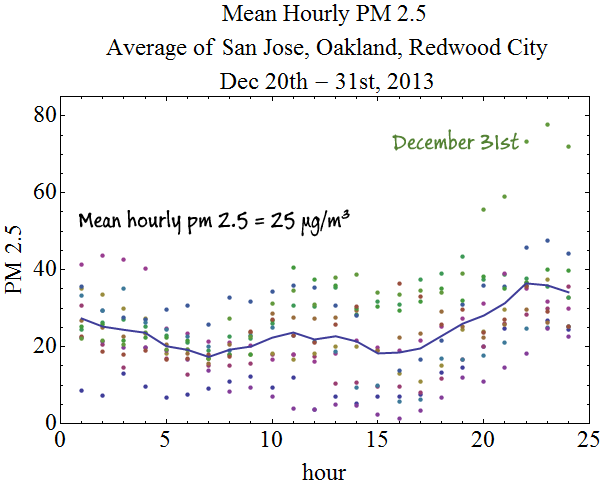
On a final note, Kurt explained that if you can smell the air, then it’s probably not safe to do outdoor exercise, no matter what time it is. He suggested looking at the air quality measurements from Christmas through New Year’s as proof, when holiday fireplaces heavily pollute the air. Fireplace smoke rises into a higher altitude layer where it hangs out for awhile, before getting mixed back into the air below. It can take days to finally clear up.
Plotting December 20th through the 31st showed a much flatter distribution of high pollution air. The “legal limit” for pm 2.5 is 30 μg/m³ and the average hourly level lies pretty close. Check out the evening hours for December 31st!
 Yikes! Thanks to Kurt Mallone for taking the time to answer my questions which allowed me to provide an update!

I enjoyed reviewing this research. I’m avid cyclist in Irvine, CA. I may consider adjusting my time of day for my rides.
You’re welcome!
Thanks for the great post! Sadly, 80% of the populations in the world is still exposed to PM 2.5.