Time and tide wait for no one. Add to that: earthquakes. I live in the San Francisco Bay Area, a.k.a. “earthquake country”, in a house built in the 1950s before earthquake building codes had been created. Within the next 30 years, the USGS tells us we can expect a “big one” in the East Bay right along the fault where I dwell.
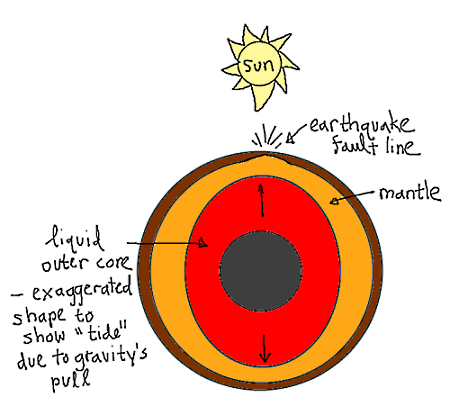
So here’s my question: If there’s a 30-year window for the next big one to occur, can I at least know the most likely time of day? This is not a crazy question. The time of day is really just a way of expressing where the sun is located with respect to your geographical location. The moon is responsible for sweeping the tides all around the Earth. So it seems reasonable to think that the moon or the sun may at least be an influence in “Earth tides” which might act as a trigger for earthquakes. Here’s a quick sketch showing my hypothesis:
This question turned out to be fairly straight-forward to answer and I’ll cut to the chase and say, yes, there are some hours that are a teeny bit more earthquake prone than others, but the variations are small — certainly not enough to use as an indicator for running out the house.
The Method
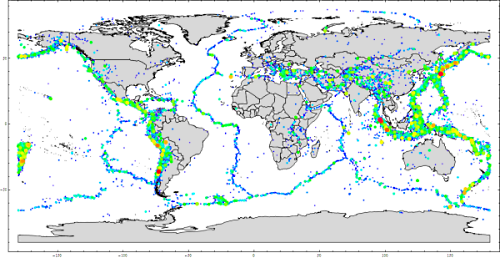
I downloaded all earthquakes magnitude 5 or greater from 1973 through mid-2011 from the USGS Global Earthquake Search website. This gave me a list of 66,725 earthquakes — a reasonable sized dataset. I mapped the positions and color-coded magnitudes of all 66,725 earthquakes (green = mag 5.0 up through red = mag 9.1), shown at the top of this blog entry.
It’s an interesting fact that these earthquakes span a time period of 338,117 hours which implies a chance of 20% for an earthquake (mag 5 or greater) during any hour. The chance during any hour for a magnitude 6 or greater earthquake drops to only 1.6%. By the time you get to a magnitude 7 or greater it’s much less than 1%/hr.
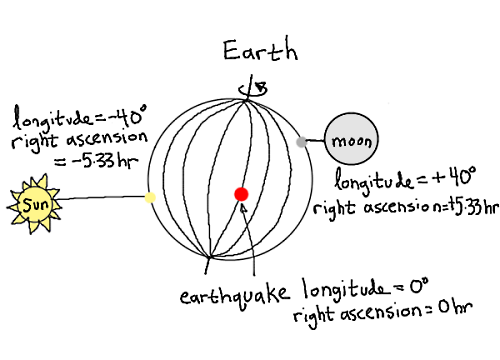
The next step was to calculate the right ascension of the sun and moon and translate the longitudinal position of each earthquake into right ascension to match. Below shows an illustration of what I’m describing.
The important thing to note is that I am calculating the longitudinal difference of the sun and moon with respect solely to an earthquake’s longitude. This is because I’m wondering about the most earthquake-prone time of day so the longitudes are the relevant quantities rather than the latitude.
After these coordinates had been calculated for all 66,725 earthquakes, I found the difference of the position of the sun/moon with respect to each earthquake in terms of right ascension. Following that, I grouped the hourly offsets and graphed the resulting histogram.
Position of the Moon and Sun vs. Earthquake Time
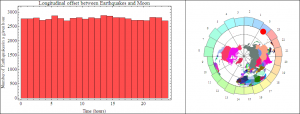
Performing the above calculation resulted in the following histogram on the left. On the right I’ve depicted the histogram relative to an example earthquake point.
Of course there are noticeable variations. But are the variations significant?
To determine this, the last step was to generate a random simulation of earthquakes around the globe with which to compare the histograms in order to measure whether the fluctuations are expected or significant.
Results
Once the random dataset was generated it was time to examine all sorts of different scenarios.
The most significant result is that there’s a notable increase in earthquakes when the moon and sun are on opposite sides of the Earth. That makes intuitive sense — the moon and sun are pulling the Earth in opposite directions which would seem to allow for increased slipping along fault lines.
There’s also a decrease in earthquakes when the moon and sun are located together in the sky. Somehow, this seems to glue the faults together.
The most interesting find was that this result was independent of location on Earth. I hypothesize this is indicative of influence closer to the Earth’s core rather than near the crust where circumferential effects are more important. However, I’m not a geologist, so feedback from a professional would be really interesting.
The results were so interesting that I wrote them up into a paper which I’m attempting to publish. Since I’m not attached to a research institution (despite the name of my website) this has proved extremely challenging. Still, I am hoping to upload the preprint to arxiv.org [update: The Association of the Moon and the Sun with Large Earthquakes was succesfully uploaded!] and have also submitted to PLoSONE.org which features open access publishing practices (although it is generally a biology-related online journal and has very limited geophysics content)
Conclusion
In short, there are times of which to be wary — watch out for the moon and sun on opposite horizons! But the increase was small enough that it would be fruitless to base any personal actions on them. Unfortunately, I’ll just have to settle for the USGS’s “sometime in the next 30 years”.
Data extracted from:
- Earthquake data from the USGS website which lists earthquake worldwide by year: http://earthquake.usgs.gov/earthquakes/eqarchives/year/
- To specify exactly which earthquakes you are interested from which database, etc (where this dataset came from): http://earthquake.usgs.gov/earthquakes/eqarchives/epic/epic_global.php
- Planet positions calculated via WolframAlpha: http://www.wolframalpha.com/
References:
- General information on the Earth: http://en.wikipedia.org/wiki/Earth


Thank you for sharing all of the work you did.
Good work. I haven’t done the deep research that you did, but I did a pie chart of the largest earthquakes (8’s on the Richter scale), and observed a concentration between mid-November
and mid-February. Do you see a similar pattern in your data?
That’s interesting! I didn’t look at that question, so I don’t know.
That would imply an effect from angle tilt with respect to the sun?
I’ve been meaning to rerun all the code with updated data from the last few years… When I have time, I’ll try to chop it by month too.
Thanks for the comment, William.